Automatic Calculation & Follow-Up Stage: Computing the Score
In the Automatic Calculation and Follow-Up Stage, we don’t need to create any more resources. The evaluator, informed by resources produced by the project manager, has created the error annotation data. The project manager has designed the scoring model to be used. Thus, we upload the necessary inputs to an automatic tool that runs the scoring model and compares the outputted overall quality score to a cutscore, delivering a final quality rating. This pass/fail quality rating is the ultimate goal of a TQE.
The automatic tool from Part A that we used for scoring is the TQE Calculator. It walks us through the automatic calculation process in three steps:
- Creating an error count table.
- Calculating the APT.
- Calculating the QS using the selected scoring model.
Any TQE system will need to be able to replicate these steps.
B3.1 Creating an Error Count Table
An MQM approach does more than simply tallying up errors. Each error annotated by the evaluator is assigned a type (with an associated weight) and a severity level (with an associated multiplier). These are the factors needed to calculate the actual number of “penalty points” incurred by the translation for each error. In terms of workflow, the error count data, prepared during the annotation stage, must be combined with the data describing the error type weights and the severity level multipliers. A mechanism for doing this is an error count table.
An error count table has a row for each error type, and a column for each severity level (usually, these are neutral, minor, major, and critical). Each row also has an error type weight, and each column has a severity level multiplier.
From there, each error type has its counts populated. The counts should be split between the severity levels. Thus, an example for data presentation in an error count table would look something like this:
TQE Error Count Table
| Error Type | Error Type Weight | Severity Levels & Multiplier | |||
| Neutral | Minor | Major | Critical | ||
| 0 | 1 | 5 | 25 | ||
| Error Type 1 | 1 | 0 | 3 | 0 | 0 |
| Error 1 Subtype | 2 | 0 | 0 | 2 | 0 |
| Error Type 2 | 1 | 0 | 7 | 0 | 0 |
The first step to using the TQE calculator is to create the error count table. Upon loading the tools, there will be a blank table present in the first section:
This table can be populated automatically or manually.
To populate it automatically, upload a metric file and TEI file (a “scorecard”) as output by the TRG Annotation Tool.
To populate it manually, modify the input text boxes for the error names, weights, and counts, as well as the severity point multipliers. To add more rows (you will likely have more than two error types), use the “+ error type” button in the upper left of the table.
A populated error table should look something like this:
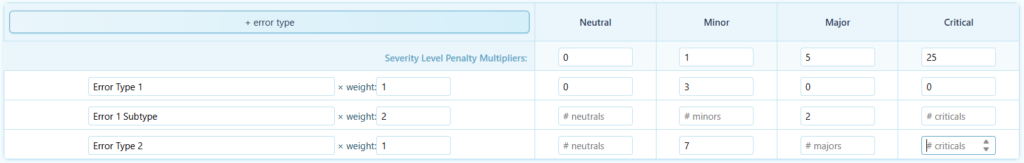
Note that an error count of zero may be expressly input as zero or simply left blank.
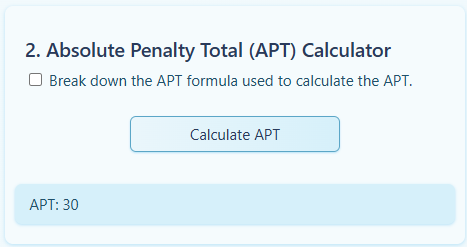
B3.2 Calculating the APT
The Absolute Penalty Total (APT) is the most important value used in QS calculation. It is summation of the Error Type Penalty Totals (ETPTs) for each error type in the project.
The ETPT of an error type is the sum of the penalty points calculated for that error type. To calculate it, the error count at each severity level is multiplied by the severity level’s multiplier. Each of these products is summated, and that sum is multiplied by the error type’s weight to obtain that error type’s ETPT.
Each of these ETPTs is added together to obtain the APT for the whole annotated translation sample:
Or, more exactly,
These calculations can be applied to an error count table:
TQE Error Count Table with Totals
| Error Type | Error Type Weight | Severity Levels & Multiplier | ETPT | |||
| Neutral | Minor | Major | Critical | |||
| 0 | 1 | 5 | 25 | |||
| Error Type 1 | 1 | 0 | 3 | 0 | 0 | 3 |
| Error 1 Subtype | 2 | 0 | 0 | 2 | 0 | 20 |
| Error Type 2 | 1 | 0 | 7 | 0 | 0 | 7 |
| APT | 30 | |||||
The error count table created in B3.1 gives all the necessary information for the TQE Calculator to perform these calculations automatically, which occurs during its second step:
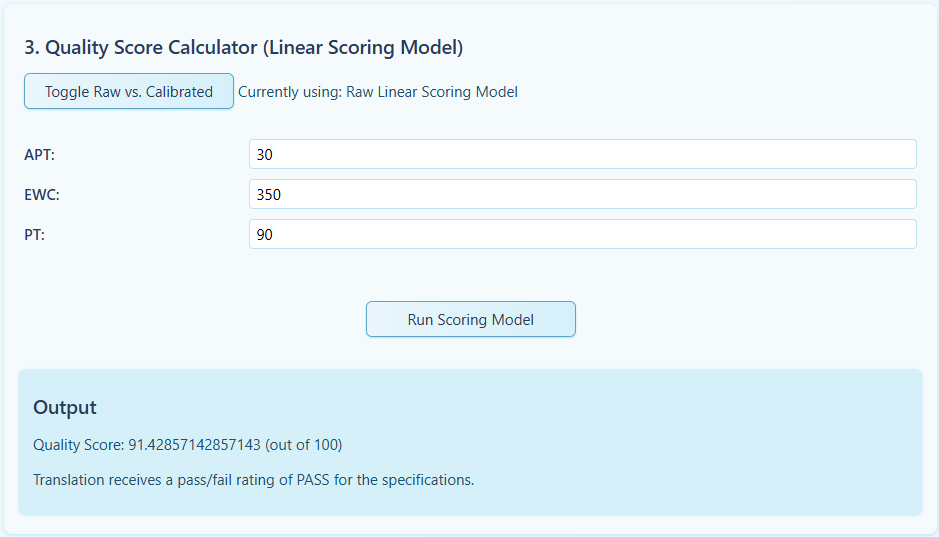
B3.3 Calculating the QS
Once the APT is calculated, it is automatically passed to the third step of the TQE Calculator, which applies a linear scoring model of the user's choice (set through the "Toggle Raw vs. Calibrated" button). Besides the APT, there are other parameters that need to be entered into the tool at this point. All except the APT and the EWC may be expressly entered into the text fields or extracted from the uploaded metric.
[make param table]
There are intermediate values calculated by both noncalibrated and calibrated linear scoring models (see B1.2.2), but these are handled behind the scenes by the TQE Calculator.
B3.3.1 Noncalibrated (Raw) Linear Scoring Models
Noncalibrated (raw) linear scoring models are described in sections 2.4.1 and 2.5.1 of The MQM Scoring Models – MQM (Multidimensional Quality Metrics).
B3.3.1 Calibrated Linear Scoring Models
Calibrated linear scoring models are described in sections 2.4.2 and 2.5.2 of The MQM Scoring Models – MQM (Multidimensional Quality Metrics).
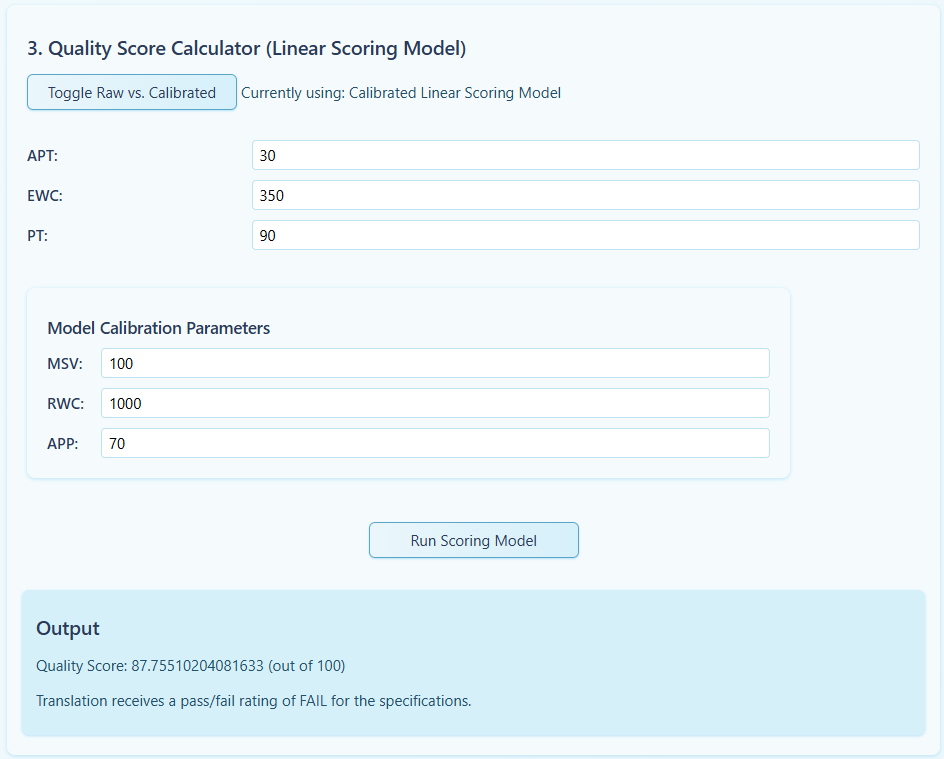
Once all parameters have been uploaded, the "Run Scoring Model" button will compute the QS and report a quality rating of PASS or FAIL.
The TQE Calculator also supplies the option to generate an Excel spreadsheet. This spreadsheet recreates the error count table and shows all calculations performed, and updates the corresponding cells if the error count table is changed. It also shows intermediate values not displayed in the webapp interface.